| / Home |
Keywords: simple linear regression, transformation, variance modelling.
CPK (creatine phosphokinase) is a enzyme contained within muscle cells which is necessary for the storage and release of energy. It can be released into the blood in response to vigorous exercise from damaged (leaky) muscle cells. This occurs often even in healthy athletes.
This study intestigated the metabolic effect of cross-country skiing. Subjects were participants in a 24 hour cross-country relay. Age, weight (kg) and blood CPK concentration 12 hours into the relay were recorded.
Data File (tab-delimited text file)
| Zuliani, U., Mandras, A., Beltrami, G. F., Bonetti, A., Montani, G., and Novarini, A. (1983). Metabolic modifications caused by sport activity: effect in leisure-time cross-country skiers. Journal of Sports Medicine and Physical Fitness, 23, 385-392. |
| Devore, J., and Peck, R. (1986). Statistics. The Exploration and Analysis of Data. West Publishing, St Paul. Exercise 4.2. |
| Smyth, G. K., and Verbyla, A. P. (1999). Double generalized linear models: approximate REML and diagnostics. In Statistical Modelling: Proceedings of the 14th International Workshop on Statistical Modelling, Graz, July 19 – 23, 1999, H. Friedl, A. Berghold, G. Kauermann (eds.). International Workshop on Statistical Modelling, Graz. Pages 66-80. |
| Smyth, G. K., and Verbyla, A. P. (1999). Adjusted likelihood methods for modelling dispersion in generalized linear models. Environmetrics 10, 696-709. (Abstract - Zipped PostScript) |
The data in Devore and Peck appear to be obtained from the plot in Zuliani et al, and rounded to the nearest 40. There are some minor discrepancies between Devore and Peck and Zuliani et al. The analysis below uses the data from Devore and Peck although the data file is as in Zuliani et al.
Regression with the original response is just significant one-sided, but the variance increases with the fitted values.
The regression equation is
CPK = 848 - 9.31 Age

Predictor       Coef       StDev          T        P
Constant       848.0       187.2       4.53    0.000
Age           -9.315       4.665      -2.00    0.063

S = 265.1       R-Sq = 19.9%     R-Sq(adj) = 14.9%

Analysis of Variance

Source       DF          SS          MS         F        P
Regression    1      280132      280132      3.99    0.063
Error        16     1124313       70270
Total        17     1404444

Unusual Observations
Obs       Age        CPK        Fit  StDev Fit   Residual    St Resid
 11      25.0     1360.0      615.1       86.5      744.9       2.97R

R denotes an observation with a large standardized residual
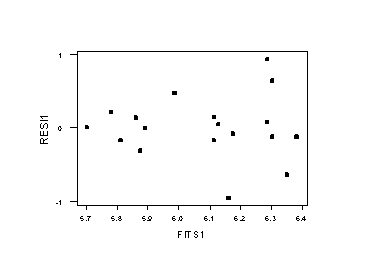
The log-transformed response is much better, but the increasing variance pattern persists:
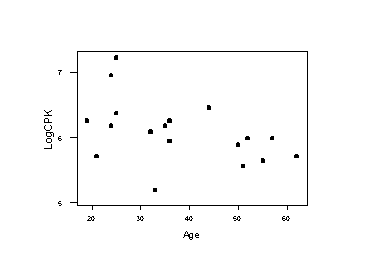
The regression equation is
LogCPK = 6.68 - 0.0158 Age

Predictor       Coef       StDev          T        P
Constant      6.6834      0.3133      21.33    0.000
Age        -0.015810    0.007806      -2.03    0.060

S = 0.4435      R-Sq = 20.4%     R-Sq(adj) = 15.4%

Analysis of Variance

Source       DF          SS          MS         F        P
Regression    1      0.8070      0.8070      4.10    0.060
Error        16      3.1473      0.1967
Total        17      3.9543

Unusual Observations
Obs       Age     LogCPK        Fit  StDev Fit   Residual    St Resid
  1      33.0      5.193      6.162      0.111     -0.969      -2.26R
 11      25.0      7.215      6.288      0.145      0.927       2.21R

R denotes an observation with a large standardized residual
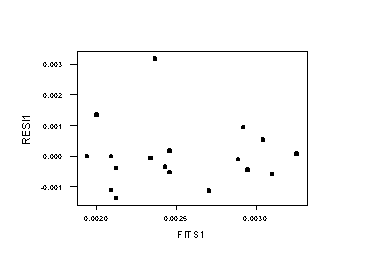
Stronger transformations, such as the reciprocal, do not seem appropriate because they cause the smallest CPK measurement to become an outlier. Variance or non-normal modelling seems appropriate.
The regression equation is
1/CPK = 0.00136 +0.000031 Age

Predictor       Coef       StDev          T        P
Constant   0.0013588   0.0007651       1.78    0.095
Age       0.00003063  0.00001906       1.61    0.128

S = 0.001083    R-Sq = 13.9%     R-Sq(adj) = 8.5%

Analysis of Variance

Source       DF          SS          MS         F        P
Regression    1 0.000003029 0.000003029      2.58    0.128
Error        16 0.000018771 0.000001173
Total        17 0.000021801

Unusual Observations
Obs       Age      1/CPK        Fit  StDev Fit   Residual    St Resid
  1      33.0   0.005556   0.002370   0.000271   0.003186       3.04R

R denotes an observation with a large standardized residual
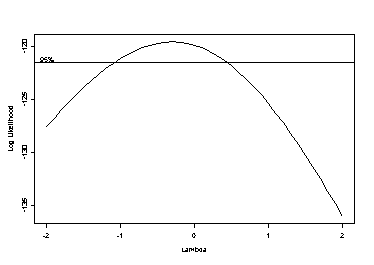
A Box-Cox plot of the linear regression also indicates a log-transformation.
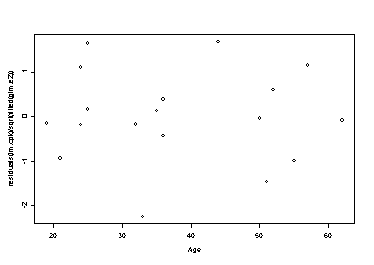
Modelling the variance in terms of Age stabilizes the variance and finds a significant mean trend:
> lm.cpk <- lm(log(CPK)~Age)
> for (i=1:3)
> {
>	e2 <- residuals(lm.cpk)^2
>	glm.e2 <- glm(e2~Age,family=Gamma(link="log"))
>	lm.cpk <- lm(log(CPK)~Age,weights=1/fitted(glm.e2))
> }
> plot(fitted(lm.cpk),residuals(lm.cpk)/sqrt(fitted(glm.e2)))

> plot(Age,residuals(lm.cpk)/sqrt(fitted(glm.e2)))
> summary(lm.cpk)

Call: lm(formula = log(CPK) ~ Age, weights = 1/fitted(glm.e2))
Residuals:
    Min      1Q   Median     3Q   Max
 -2.253 -0.3778 -0.06609 0.5409 1.676

Coefficients:
               Value Std. Error  t value Pr(>|t|)
(Intercept)   6.6498   0.3228    20.6025   0.0000
        Age  -0.0151   0.0063    -2.3967   0.0291

Residual standard error: 1.061 on 16 degrees of freedom
Multiple R-Squared: 0.2642
F-statistic: 5.744 on 1 and 16 degrees of freedom, the p-value is 0.02911

Correlation of Coefficients:
    (Intercept)
Age -0.9763
|
Home - About Us -
Contact Us Copyright © Gordon Smyth |