| / Home |
Keywords: regression, weighted regression, regression through the origin.
The following data from the Statistical Abstract of the United States give the number of accidental oil spills at sea and the amount of oil lost in these spills for the years 1973 - 1985.
| Variable | Description | ||
| Year | Year | ||
| Spills | Number of spills | ||
| Oil | Amount of oil lost (thousands of metric tonnes) | ||
Data File (tab-delimited text)
| Statistical Abstract of the United States 1987. |
| Hamilton, L. C. (1992). Regression with Graphics. Duxbury Press, Belmont, California, page 49. |
| Hamilton (1992) gives the units for Oil as millions of metric tons. Berwin Turlach, University of Western Australia, points out using historical data that the units are more likely to be thousands of metric tonnes. |
Clearly the number of spills is clearly decreasing over time. It is reasonable to look then at the amount of oil per spill.
An unweighted regression of Oil on Spill is inappropriate:
The regression equation is
Oil = - 44 + 6.96 Spills
Predictor        Coef       StDev          T        P
Constant        -44.5       102.7      -0.43    0.673
Spills          6.957       2.832       2.46    0.032
S = 166.5 R-Sq = 35.4% R-Sq(adj) = 29.6%
Analysis of Variance
Source            DF          SS          MS         F        P
Regression         1      167218      167218      6.03    0.032
Residual Error    11      304844       27713
Total             12      472062
Unusual Observations
Obs     Spills        Oil         Fit   StDev Fit    Residual    St Resid
  7       65.0      723.5       407.7       103.3       315.8        2.42R
 11       17.0      387.8        73.8        63.5       314.0        2.04R
R denotes an observation with a large standardized residual
The variance is proportional to the number of spills included. This changes the regression coefficient somewhat and reduces the standard errors:
Weighted analysis using weights in 1/Spills
The regression equation is
Oil = - 13.6 + 6.00 Spills
Predictor        Coef       StDev          T        P
Constant       -13.56       68.32      -0.20    0.846
Spills          6.002       2.564       2.34    0.039
S = 29.89 R-Sq = 33.3% R-Sq(adj) = 27.2%
Analysis of Variance
Source            DF          SS          MS         F        P
Regression         1      4896.2      4896.2      5.48    0.039
Residual Error    11      9826.5       893.3
Total             12     14722.7
Unusual Observations
Obs     Spills        Oil         Fit   StDev Fit    Residual    St Resid
 11       17.0     387.80       88.47       40.82      299.33        2.57R
R denotes an observation with a large standardized residual
The intercept should in principle not be required. The average size of a spill is about 5.6:
Weighted analysis using weights in 1/Spills
The regression equation is
Oil = 5.58 Spills
Predictor        Coef       StDev          T        P
Noconstant
Spills          5.583       1.397       4.00    0.002
S = 28.67
Analysis of Variance
Source            DF          SS          MS         F        P
Regression         1       13123       13123     15.97    0.002
Residual Error    12        9862         822
Total             13       22985
Unusual Observations
Obs     Spills        Oil         Fit   StDev Fit    Residual    St Resid
 11       17.0     387.80       94.91       23.75      292.89        2.53R
R denotes an observation with a large standardized residual
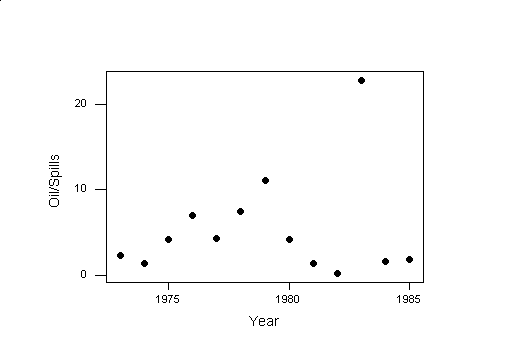
Is the average spill size changing with time? Now we must weight proportion to the number of spills:
Weighted analysis using weights in Spills
The regression equation is
Oil/Spills = - 991 + 0.504 Year
Predictor        Coef       StDev          T        P

Constant       -991.2       863.4      -1.15    0.275
Year           0.5040      0.4366       1.15    0.273
S = 28.28 R-Sq = 10.8% R-Sq(adj) = 2.7%
Analysis of Variance
Source            DF          SS          MS         F        P
Regression         1      1065.8      1065.8      1.33    0.273
Residual Error    11      8795.9       799.6
Total             12      9861.7
Unusual Observations
Obs       Year   Oil/Spil         Fit   StDev Fit    Residual    St Resid
 11       1983      22.81        8.25        2.69       14.57        2.31R
R denotes an observation with a large standardized residual
The year 1983 appears to be an outlier.
|
Home - About Us -
Contact Us Copyright © Gordon Smyth |